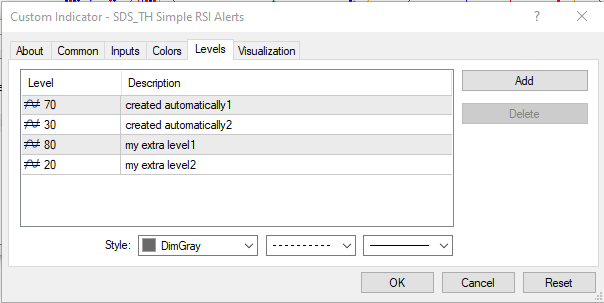
By default the Simple RSI Alert indicator will plots just two levels in the RSI subwindow which correspond to the overbought and the oversold levels. However, some users like to have more than just two levels showing. However, you have to be careful as when the indicator is loaded into a chart it automatically creates two levels at the top of the list. So in order to add extra levels and not to have them overwritten each time you load the indicator, you have to do things in the correct order. Please follow the instructions below.

Adding extra levels on the Levels panel
Once you’ve set up your extra levels in the correct order as described above then they should correctly load each time. If you want to apply this set-up to other charts the easiest way to do this is to create a template. Set up a chart as you want it and then save it as a template – use the Charts | Template | Save Template menu option to save it. Then every time you want to apply this layout to a new chart just use Charts | Template | Load Template to apply it to the new chart. Alternatively you can use the template button where you will find both the save and the load options in the dropdown on the button.


